RQDA: How an open source alternative to ATLAS.ti, MAXQDA, and NVivo opens new possibilities for qualitative data analysis

Coding CVs of members of the Bundestag using RQDA

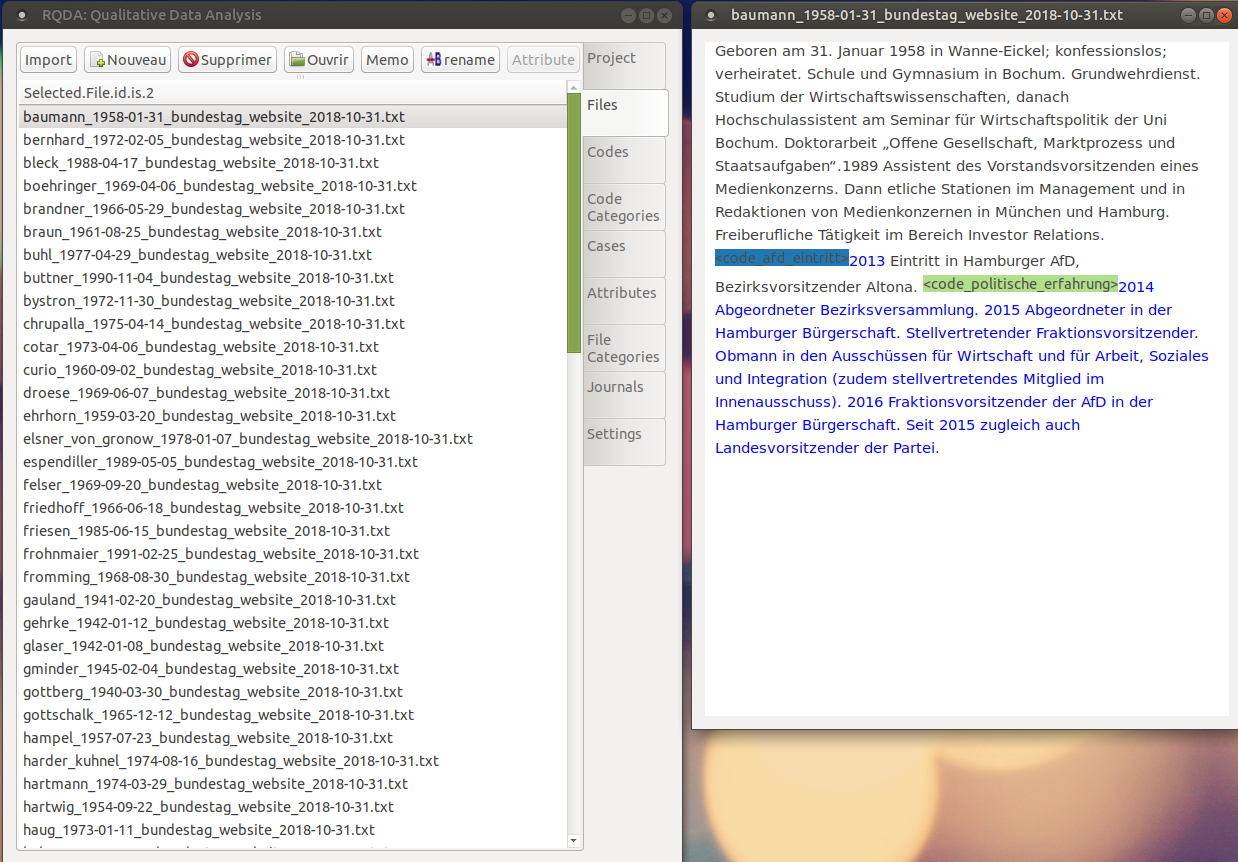
At the WZB, as part of a project on the AfD (the new radical right party in Germany), I recently had to analyze CVs of Members of the Bundestag. The idea was to automatically download the MPs’ profiles from the Bundestag website using web scraping techniques and then to describe the social structure of the AfD faction using quantitative and qualitative methods. I was particularly interested in the prior political experience of the AfD representatives. Extracting this type of information automatically is difficult and I opted to code some of the material manually.

I was looking for a tool to work with the data collected. In social sciences, ATLAS.ti, MAXQDA, and NVivo are the most commonly used programs to analyze qualitative data. Yet, these programs are expensive and not everyone is able to afford a license. Also, I simply did not need all the bells and whistles offered by these tools (I suspect I am not the only one in this situation).

The essence of qualitative data analysis (QDA) is to annotate text using relevant codes. Think of a computer-assisted qualitative data analysis software (CAQDAS) as a super highlighter (your brain is still doing the hard stuff). The rest – extracting content from PDF files, combining codes, visualizing them, etc. – can be performed by other programs. These functions do not have to be necessarily bundled with QDA programs.

I took a look at RQDA, a free, light, and open-source CAQDAS built on top of R. RQDA was designed by Ronggui Huang from Fudan University, Shanghai, and has been used in a number of publications. The package is still in development (current version 0.3-1) and some bugs are apparent. Yet, RQDA does the essential right. It allows you to import text files (in many languages), code them using a graphical interface, and store your codes (and their meta-information) in a usable format.

What I find particularly exciting about RQDA is that it lets you use the powerful machinery of R. Compared to other programs that work with closed software environments, RQDA is highly expandable. Think of all the R packages available to manipulate, analyze, and visualize textual data. Combining qualitative and quantitative data is also really easy, which makes RQDA a very good tool for mixed methods.

Most importantly, since RQDA is free and open-source, anyone with an Internet access can download R and RQDA and reanalyze coded texts. Sometimes qualitative data contains sensitive information and it is not advisable to share it. Yet, often, scholars analyze data that is already public (as I do). In this case, it might be interesting to put your coding schemes online.

Researchers usually agree that quantitative methods should be reproducible. This means that it should be possible to reproduce the findings of a publication (tables and figures) by re-running code on the raw data. I argue that qualitative research, when it does not use sensitive data, should be traceable, in the sense that others should have the possibility to go back to the source texts, examine the context, and reinterpret the coding. Simply by being free and open source, RQDA facilitates the diffusion and reuse of qualitative material and makes qualitative research more traceable.

There are good RQDA tutorials online, especially the Youtube series prepared by Metin Caliskan, in French and English (see also, Chandra and Shang 2017; Estrada 2017). I learned a lot from these demonstrations and made good progress with the coding of the CVs of the members of the Bundestag. I am really satisfied with RQDA and, for the moment, do not feel the need to move to proprietary software.

New vignette: How to apply Oesch’s class schema on data from the European Social Survey (ESS) using R

Daniel Oesch (University of Lausanne) has developped a schema of social classes, which he discusses and applies in different publications. On his personnal website, he offers Stata, SPSS, and SAS scripts to generate the class schema with data from different surveys.

Scholars working with other programs (especially R) might be interested in using Oesch’s class schema as well. In this vignette, I show how to apply Oesch’s class schema on data from the European Social Survey (ESS) using R. See:

How to apply Oesch’s class schema on data from the European Social Survey (ESS) using R

Vignette: Identifying East and West Germans in the European Social Survey using R

As a complement to my recent paper on “Generations and Protest in Eastern Germany,” I have prepared a vignette explaining how to identify East and West Germans in the European Social Survey (ESS), while accounting for east-west migration in Germany. The categorization follows a political socialization approach. You can find the vignette here:

Identifying East and West Germans in the European Social Survey: A demonstration in R

The vignette was writen in R markdown and the original script is available on my GitHub page.

Learning Git the wrong way

Git is a version control system. It keeps track of changes within files and allows for complex collaborative work. While it is mostly used by programmers for storing and sharing code, it can theoretically work with any type of file (text, images, etc.). GitHub is the most-used hosting service for Git. On Github, users store and make their Git repositories available to others.

The Git workflow is highly valued in the open science community for a few reasons. It is fast, secure, and well-suited for coordinating large collaborative projects. The characteristic feature of Git is its branch system which allows users to work on different lines of development in parallel. Branches can be easily merged or deleted with minimal risk of losing valuable material.

Inspired by other fellows and mentors of the Fellowship Freies Wissen, I started to use Git and GitHub about two months ago. However, I quickly faced difficulties.

The problem was that I took the wrong approach with Git. When learning a new computer skill (like R), I usually start experimenting early in the process and learn by solving the inevitable problems that come along the way. This “hands-on” approach proved to be more complicated with Git. While I was trying to keep track of the changes on my PhD project, I got rapidly confused by the concept of “staging area” and struggled moving from one branch to the other.

I realized that to start using Git efficiently I would need a more solid theoretical understanding of the system.

I stopped using Git with my project for a while and went back to the basics. I started reading Pro Git, 2nd edition, written by Scott Chacon and Ben Straub (Apress, 2018) and followed through the explanations with example repositories containing simple .txt files. I performed all the operations in Bash, the command-line system, instead of using a GUI.

Pro Git is a great resource: it is distributed under Creative Commons license and was translated in many languages. You can find the book in html, pdf, and other formats here.

If you are also starting to learn Git I would recommend going through the first three chapters (“Getting Started”, “Git Basics”, “Git Branching”) and the first sections of the chapter on GitHub. That’s about 120 pages.

Taking the time to learn Git properly proved very useful. After a few hours of reading, I was able to take advantage of most of the basic functions of Git. More and more, I am discovering the advantages of Git and wished I had learned it earlier.

You can now follow my work on GitHub here. I will continue to post vignettes in R and will distribute replication material for my papers.

Vignette: Improving the harmonization of repeated cross-national surveys with the R mice package

As part of the Freies Wissen Fellowship, I have prepared a vignette on:

Using multiple imputation to improve the harmonization of repeated cross-national surveys

The vignette introduces a technique for coping with the problem of systematically missing data in longitudinal social and political surveys.

The project combines many aspects of open science:

  • The multiple imputation procedure was implemented in R, a programming language and free software environment for statistical computing.
  • The text and the code of the vignette were prepared in R markdown, a form of literate programming. Literate programming makes research more transparent and reproducible. It is also a nice tool for the development of open educational resources (OER).
  • Finally, all the material of the vignette is on my GitHub page, where users can clone the repository, comment, and suggest modifications.